Houston · Texas · 2026 ratings on verified STAAR data

Best School Districts in Houston, Texas

Houston's 55 rated districts run from 4.5 to 8.8. The five a mover actually chooses among sit between 6.0 and 7.3, and the boundary you buy inside matters more than the name.

The fieldAverage campus rating of every ranked district, on the 1–10 scale.
District averages run4.5Tarkington ISDto8.8Barbers Hill ISDon the one-to-ten scale.

55 districts rated · the Houston five 6.0–7.3 · median district 6.4

The brief

I'm choosing a school for

The top-rated school districts in metro Houston for 2026 are Barbers Hill ISD (8.8/10), Needville ISD (8.6/10), and Dickinson ISD (7.8/10), based on MySchoolScout's analysis of real STAAR results across 55 traditional districts (1,382 schools with verified test data). Among large districts, Galena Park ISD ranks highest (7.5/10). Barbers Hill ISD offers the best value, outscoring what its student-poverty level predicts by 2.1 points. Galena Park ISD is the most improved, gaining 8.1 points in STAAR proficiency since 2022.

The Houston five

Each district's rated campuses on one 1–10 axis, best median first.
  1. Katy ISD71 rated
    7.4
  2. 7.1
  3. Houston ISD262 rated
    7.0
  4. 6.3
  5. Aldine ISD65 rated
    6.2
The five districts most Houston movers weigh have median campuses from Aldine ISD's 6.2 to Katy ISD's 7.4, and Houston ISD's 2.2–9.5 range is the widest of the five.Medians over campuses with verified state test data only (Katy 71 · Cypress-Fairbanks 87 · Houston 262 · Spring Branch 39 · Aldine 65 campuses rated). Source: MySchoolScout ratings.

The field

Every ranked district on one 1–10 axis, grouped by size. The wider the mark, the more students.

All 55 districts, ranked

Average campus rating · students
  1. 1Barbers Hill ISD8.87,723
  2. 2Needville ISD8.63,598
  3. 3Dickinson ISD7.812,592
  4. 4Danbury ISD7.6661
  5. 5Galena Park ISD7.521,105
  6. 6Katy ISD7.394,785
  7. 7Tomball ISD7.122,273
  8. 8Alvin ISD7.029,740
  9. 9Houston ISD6.9184,109
  10. 10Cypress-Fairbanks ISD6.9118,470
  11. 11Magnolia ISD6.914,468
  12. 12Klein ISD6.953,093
  13. 13Pearland ISD6.821,111
  14. 14Pasadena ISD6.847,486
  15. 15Sweeny ISD6.81,933
  16. 16Conroe ISD6.772,352
  17. 17Santa Fe ISD6.74,397
  18. 18Friendswood ISD6.76,210
  19. 19Humble ISD6.648,552
  20. 20Brazosport ISD6.611,357
  21. 21Crosby ISD6.66,868
  22. 22Texas City ISD6.67,874
  23. 23Channelview ISD6.69,434
  24. 24Fort Bend ISD6.680,206
  25. 25Deer Park ISD6.512,122
  26. 26East Chambers ISD6.41,563
  27. 27Lamar CISD6.444,512
  28. 28Waller ISD6.49,283
  29. 29La Porte ISD6.37,115
  30. 30Clear Creek ISD6.340,132
  31. 31Angleton ISD6.37,068
  32. 32Galveston ISD6.36,446
  33. 33Alief ISD6.339,474
  34. 34Willis ISD6.28,974
  35. 35Hempstead ISD6.21,582
  36. 36Hitchcock ISD6.21,899
  37. 37Montgomery ISD6.19,794
  38. 38Aldine ISD6.157,844
  39. 39New Caney ISD6.118,987
  40. 40Anahuac ISD6.11,547
  41. 41Sheldon ISD6.011,028
  42. 42Spring Branch ISD6.033,407
  43. 43Royal ISD5.82,729
  44. 44Goose Creek CISD5.724,108
  45. 45Stafford Msd5.63,479
  46. 46Spring ISD5.533,935
  47. 47Hull-Daisetta ISD5.4416
  48. 48Columbia-Brazoria ISD5.32,954
  49. 49Splendora ISD5.35,221
  50. 50Hardin ISD5.11,239
  51. 51Cleveland ISD5.011,970
  52. 52Dayton ISD5.05,787
  53. 53Liberty ISD4.72,424
  54. 54Huffman ISD4.73,679
  55. 55Tarkington ISD4.51,928

Charter networks

Open enrollment, not zoned · the 9 highest-rated of 20

Beats the odds

Rating above what student poverty predicts, best first.

+2.1Barbers Hill ISD

  1. Needville ISD+2.0
  2. Galena Park ISD+1.5
  3. Dickinson ISD+1.4
  4. Danbury ISD+1.0
Barbers Hill ISD rates 8.8 with 34% of students economically disadvantaged, 2.1 points above what its poverty level predicts.Rating minus the rating predicted by student poverty, fitted across the 55 ranked districts. Source: MySchoolScout ratings, NCES CCD.

Most improved

Change in STAAR proficiency, 2022 to 2024, largest gain first.

+8.1Galena Park ISD

  1. Aldine ISD+6.3
  2. Spring Branch ISD+5.4
  3. Tomball ISD+4.9
  4. Pasadena ISD+4.6
Galena Park ISD gained 8.1 points of STAAR proficiency between 2022 and 2024, the largest gain among the 55 ranked districts.Blended math and reading proficiency, all grades, in 2022 and 2024, the two comparable STAAR years. Source: Texas Education Agency.

The map

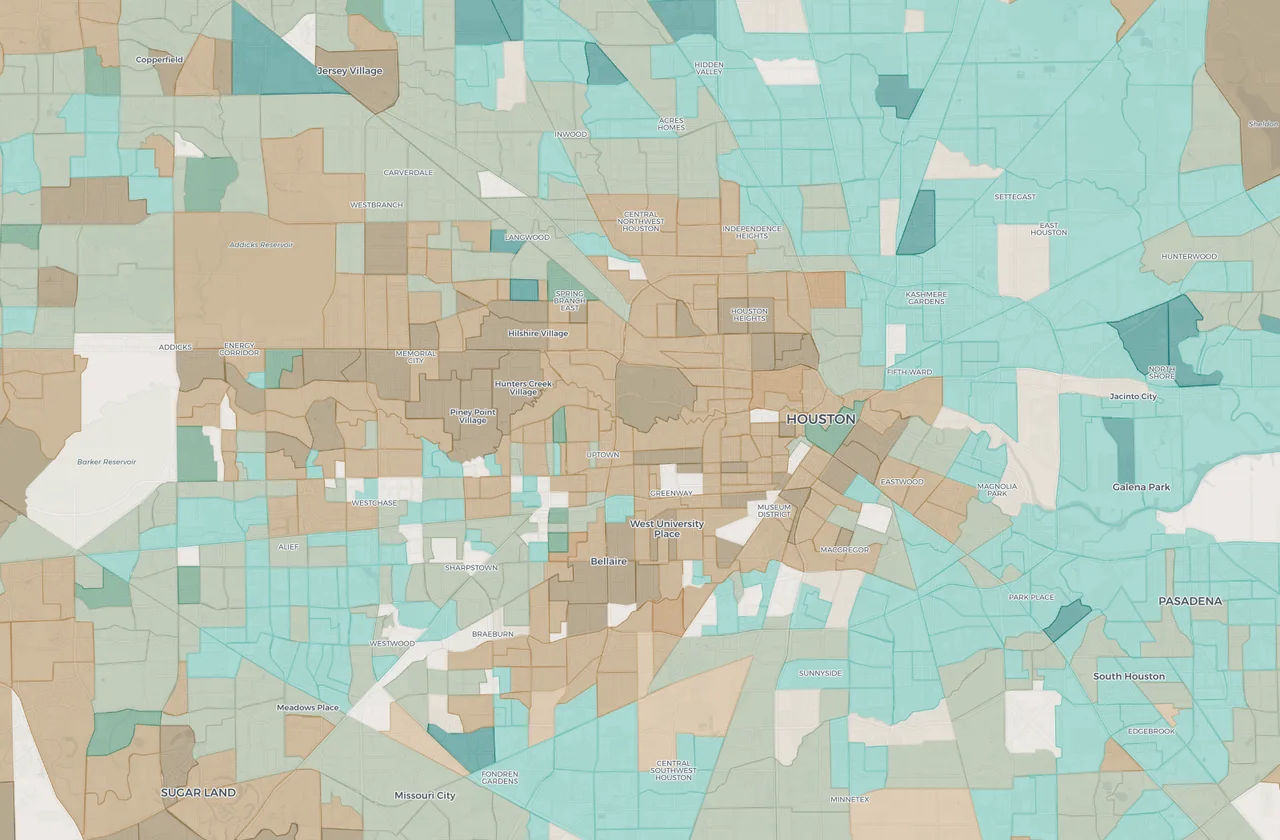
Houston school quality and housing cost map showing downtown and west-side neighborhoods.Interactive mapOpen the Houston school map
School quality set against home prices, tract by tract, shows where a Houston shortlist is actually reachable.Bivariate map: MySchoolScout campus ratings and ACS median home value by census tract. The frame shows central Houston, and the map covers all 10 counties.

Check the address after you compare

This page helps you compare school and district profiles. When you have a prospective address, use the district-published tool for its current zoned-school result. A transfer or Choice request is a separate process.

Considering a different campus?

Katy's transfer page describes a request for a campus other than the one assigned from a home address and says approval is not guaranteed. Cy-Fair and Spring Branch publish separate transfer or Choice routes. Read the district's current requirements before relying on either path.

Example: Comparing a prospective Katy address with a prospective Cy-Fair address? Keep the district and school profiles from this page open, then enter each address in the district-published tool. If either zoned-school result is not the campus you want, open that district's separate transfer or Choice page. The address lookup does not decide a different-campus request.

Published by the MySchoolScout Team. See our methodology and data sources. Found an error? Report a correction.

Questions movers ask

What are the best school districts in Houston?

For 2026, the top-rated districts in metro Houston are Barbers Hill ISD (8.8/10), Needville ISD (8.6/10), Dickinson ISD (7.8/10). Ratings are MySchoolScout composite scores (1–10) computed only from schools with real STAAR test data — proxy-estimated schools are excluded.

Which Houston school district is the best value?

Barbers Hill ISD offers the strongest "beats the odds" value: its 8.8/10 rating is about 2.1 points higher than its student-poverty level (34% economically disadvantaged) would predict. That means strong outcomes without the price tag of the most affluent districts.

Which Houston-area district has improved the most?

Galena Park ISD improved the most among the districts we rank, gaining 8.1 percentage points in STAAR proficiency between 2022 and 2024 (the two most recent comparable testing years).

How many school districts are in the Houston area?

This ranking covers 55 traditional school districts across the Houston metro with at least three schools that have real test data, plus 20 charter networks listed separately. Together they enroll hundreds of thousands of students across 1,382 rated schools.

How do Houston hubs connect to this ranking?

This district listicle is one spoke of Houston school rankings. Start from the Houston city hub or the Texas state hub, then return here for metro district comparison.

Where are the Houston school-level rankings?

Houston has a separate ranking listicle for each school level. Open the elementary, middle, and high school rankings.

How does MySchoolScout rank Houston districts?

Districts with enough real-data schools receive a 1–10 rating: the average MySchoolScout composite score of those schools, using only schools with real, non-estimated test data. School composites blend student growth, poverty-adjusted academic achievement, and school environment — plus college readiness for high schools — with weights that vary by school level, computed within Texas so districts are compared to in-state peers. Data: Texas Education Agency STAAR results, NCES, and the U.S. Census. See the methodology page and the Houston city hub for context.

Keep reading

Best Schools in Houston, TX: 2026 Rankings

Houston's 899 schools average 4.9 out of 10 and the strongest cluster in a handful of corridors, so the district line your address falls on is worth checking before you settle on a neighborhood.

Explore more

Data from NCES Common Core of Data, Texas Education Agency, and U.S. Census ACS for the 2023–24 school year. Rankings computed by MySchoolScout. See all data sources.