How school ratings work when you are moving
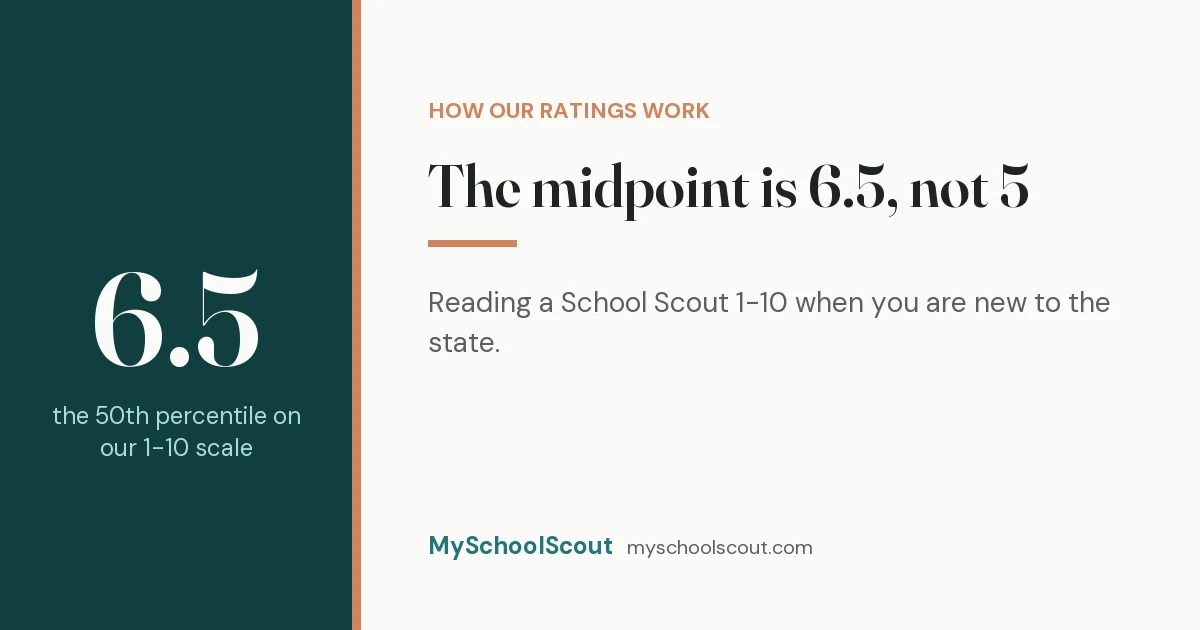
A School Scout 1-10 ranks a school against the other schools in its own state, so the midpoint is 6.5 and a 7 in Texas is not a 7 anywhere else. Here is what the number counts, what it estimates, and where it tells you it is guessing.
The number is a rank inside a state, with a curve on it
Start with what the 1–10 next to a school’s name actually is. Every public school we score is ranked against the other public schools in its own state on each thing we measure, and each of those ranks is a percentile. The percentile then goes through a power curve with exponent 0.7, which bends the whole scale upward.
Three anchors, straight from the comment in our own code: the 5th percentile lands at 2.1, the 50th at 6.5, the 95th at 9.7. So the middle of the pack is a 6.5, not a 5. A school showing a 6 is a little below its state’s median. People find that surprising. We chose the curve so the bottom stays honest and the top stays meaningful, and the price is that “6 out of 10” reads better than it is. Now you know.
A 7 in Texas and a 7 in the state you left are different claims
Because the percentile is taken within the school’s own state, the number says “this school sits here among the schools of Texas.” It does not say “this school sits here among the schools of America.” A 7 in Houston and a 7 in the metro you are leaving are both statements about position inside two different populations, and nothing in the score converts one into the other.
That is a limitation. We would rather say so than let you find out after you have signed a lease.
What to do instead: compare inside the metro you are moving to. Every school on a Houston shortlist is ranked against the same Texas pool. Then look past the single number to the spread. The Houston districts hub puts the metro’s districts side by side, and the Houston map shows where the strong and weak tracts sit relative to each other. A 7 means a great deal more once you can see what the 5s and 9s around it look like.
Growth versus proficiency, and why the weights change with grade
Two of the things we measure sound alike and are not. Proficiency is the newest year’s percent-proficient, a snapshot. Growth is a weighted slope across several years of results, with COVID-era years carried at half weight. One says where the students are. The other says which way they are moving.
How much each counts depends on the school’s grade span. These are the weights for public schools, copied from the ranking engine:
| School level | Growth | Adjusted academic | College readiness | Environment |
|---|---|---|---|---|
| Primary / elementary | 0.50 | 0.30 | n/a | 0.20 |
| Middle | 0.40 | 0.35 | n/a | 0.25 |
| High (and K-12 / other configurations) | 0.25 | 0.25 | 0.30 | 0.20 |
Read the shape. At elementary, growth is half the score. At middle it is still the biggest piece. At high school the biggest single piece is college readiness at 0.30, and growth drops to a quarter.
Private schools are a separate model. They run on five different components and are ranked only against other private schools in the same state, so a private 7 and a public 7 are not the same measurement. Everything below is about public schools.
The practical consequence: a kindergartner’s school is judged mostly on how much its students improve year over year, because growth on its own is half the score. At an 11th grader’s school nothing is a majority, and the largest piece, at 0.30, is what happens around graduation. If you are moving a child from one of those bands into the other, the 1–10 next to the new school is answering a different question than the one next to the old school did. Same scale, different test.
One more rule from the same file: a school needs a minimum number of scored pieces before we will rate it at all, 2 for primary, elementary and middle schools and 3 for high schools and other configurations. Scored, not measured. An estimated academic score counts as one of those pieces, which is how a school with no test data of its own gets rated at all. More on that two sections down.
What “adjusted academic” adjusts
We do not put raw proficiency into the score by itself, and the reason is blunt. A raw percent-proficient number, ranked on its own, would mostly rank neighborhoods by income. You would be looking at a housing-market map with school names on it.
So the academic piece is a blend: 60% the school’s raw proficiency percentile, 40% a poverty-residual percentile, meaning how the school does relative to what its poverty level would predict. That blend is why the field is called “adjusted academic” rather than “test scores.” It is still mostly the snapshot, but one asked to account for who walked in the door.
Estimated scores, and one thing that stays out of the number
Some public schools have no test data of their own. Instead of leaving them blank, the engine estimates an academic score from the schools around them: a city-level average where enough nearby schools exist, otherwise a state-level average. It then discounts the academic weight before building the composite, so an estimate counts for less than a measurement would. It still counts toward the minimum from two sections ago, which is how one of these schools ends up rated at all.
When that has happened, the school page says so with a badge reading “Estimated academic score.” Treat it as a placeholder, not a reading. Do not rank a badged school against a measured 7 next door as if the two were the same kind of thing. Go read the district instead. The Houston ISD brief tells you what the district around that school looks like, which is the most you can honestly say about a school we could not measure directly.
We also compute an equity figure for each school and show it on the page. It is not in the 1–10. Read it next to the score, not inside it, and move on.
What the map is telling you, in two halves
The default Houston map colors each neighborhood tract by two things at once. The first is school quality: the average school score in the tract, in three bands, below 4, 4 to under 7, and 7 or above. The second is housing cost relative to the metro: the tract’s typical home value divided by the metro’s median, again in three bands, under 0.8 of the median, 0.8 to 1.2, and above 1.2. The cell that sits in the strong-schools, below-median-cost corner is the one every relocating family is hunting for, and the map exists to show where those cells are and where they are not.
The honest part: if a tract is missing either half, it is painted the no-data neutral, never a color from the ramp. The comment in the code says it plainly: “Any missing axis ends the comparison: a bivariate cell is a claim about BOTH dimensions, and we can only make it when we hold both.” An earlier version did guess. It filled a missing axis with the middle band, and on four metro hero frames that guess covered 34–52% of tracts, 45.3% of the Atlanta frame. Nearly half of a map was quietly asserting “average” about tracts we had no data for. We changed it. A neutral tract now means we do not know, which is less pretty and more true.
What to do this week
Run this on Houston, or swap in your own metro.
- Open the Houston map and look at the spread before any single school. Which strong-school tracts also sit below the metro’s median home value?
- Go to the Houston districts hub and compare districts against each other. Everything on that page is ranked inside the same state, so the numbers are comparable.
- Pick one district and read its brief in full. Houston ISD is a good first one; our Houston schools guide is the companion when you get to individual schools.
- Then read the methodology page, which walks the whole model. One honest warning about it: parts of that page still describe an earlier version of the scoring and we are rewriting them. Where the page and this post disagree, this post is the newer account.
The point is to trust the number precisely: a Texas percentile, bent upward and weighted by grade, that tells you when it is guessing.
Get school insights in your inbox
New rankings and parent guides, free. No spam, unsubscribe anytime.
We respect your privacy. Unsubscribe at any time.