
Public schools · Arizona · Ratings on state test data

Best Schools in Arizona (2026)

Moving to Arizona? 135 districts have enough rated campuses to compare, from Career Success Schools (79047) at the bottom of the field to Chinle Unified District (4158) at the top, and the boundary you choose inside a metro matters more than the state line.

The fieldAverage campus rating of every comparable district, on the 1–10 scale.
District averages run4.3Career Success Schools (79047)to8.2Chinle Unified District (4158)on the one-to-ten scale.

135 districts rated · median district 6.3

The way in

I'm choosing a school for
  1. Phoenix

    Explore the school map across 2 counties.
    Show mapHide map
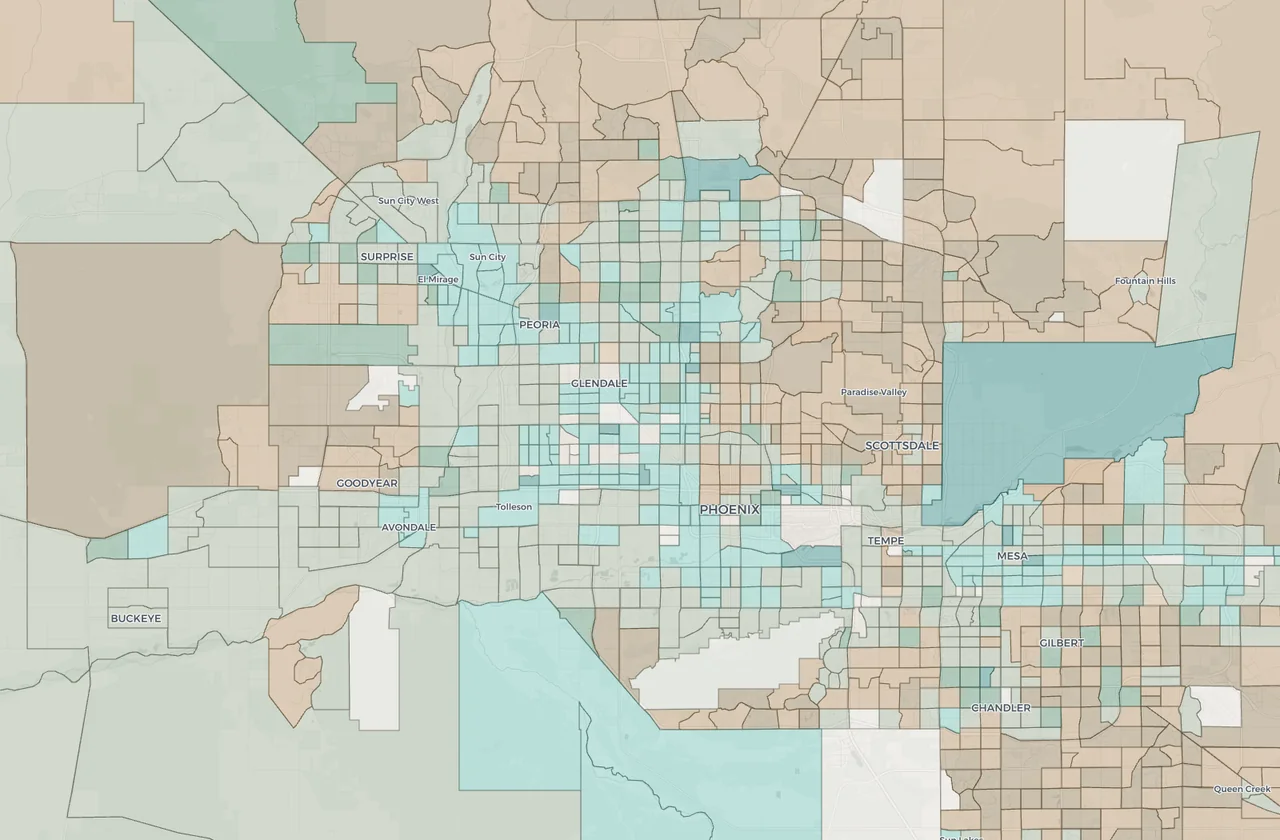
    Phoenix-area school quality and housing cost map spanning Glendale, Scottsdale, Mesa, and Chandler.Interactive mapOpen the Phoenix school map
    School quality set against home prices, tract by tract, shows where a Phoenix shortlist is actually reachable.Bivariate map: MySchoolScout campus ratings and ACS median home value by census tract. The frame shows central Phoenix, and the map covers all 2 counties.

The districts

Every comparable district on one 1–10 axis, by size.

The ten highest-rated of 135 comparable districts

Average campus rating · rated campuses · students

The schools

The ten highest-rated schools; open a profile for the evidence.

The map

Where the highest-rated schools sit.
The 49 highest-rated schools in Arizona, pinned and colored by score.Pins are locations, not attendance boundaries.

The cities

The twenty places with the most schools.

Student demographics

  • White54.5%
  • Hispanic or Latino27.1%
  • Black or African American6.1%
  • Two or More Races5.2%
  • Asian4.2%
  • American Indian/Alaska Native2.5%
  • Native Hawaiian/Pacific Islander0.5%

Weighted by each source's student count across 336 schools. Source: NCES Private School Universe Survey (PSS) · SY 2023–24; NCES Private School Universe Survey (PSS) · SY 2021–22.

The record

Total schools
2,564
public and private · 2.1% of all US schools listed
Districts
701
Cities/towns
210
Average rating
6.4
out of 10 · 2,245 rated schools
Math proficiency
42%
avg across schools with state test results
ELA proficiency
49%
avg across schools with state test results
Avg student-teacher ratio
16.9:1
Estimated scores
2%
60 of 2,564 schools use estimated academic data from nearby schools
National rank
#22 of 52
states by avg. composite
Vs. national average
+0.0
above US avg (6.4)
Coverage
88%
of schools with a rating

Community profile

Averages across 335 ZIP codes (Census ACS 5-year estimates)

Median income
$71,075
Median home value
$313,112
Median rent
$1,292/mo
College educated
27%
Avg commute
26 min
Poverty rate
16.3%

Questions

How many schools are ranked in Arizona?

MySchoolScout lists 2,564 public and private schools across 701 districts in Arizona, and 2,245 of them have a MySchoolScout rating.

What is the average school rating in Arizona?

The average MySchoolScout composite score for the 2,245 rated schools in Arizona is 6.4 out of 10.

What percentage of students in Arizona are proficient in math?

On average, 42.2% of students are proficient in math across Arizona schools with state test results, based on the most recent state assessment data.

What percentage of students in Arizona are proficient in reading?

On average, 48.5% of students are proficient in reading and ELA across Arizona schools with state test results, based on the most recent state assessment data.

What is the average student-teacher ratio in Arizona?

The average student-teacher ratio across Arizona schools that report one is 16.9:1.

What is the top-ranked school in Arizona?

The top-ranked school in Arizona on MySchoolScout is Alpine Elementary School in Alpine, with a composite score of 10.0/10.

How does MySchoolScout rate schools in Arizona?

MySchoolScout rates schools using publicly available data from the NCES Common Core of Data and the Arizona Department of Education. Schools with enough data receive a 1-10 composite score built from Student Growth, Poverty-Adjusted Academic Achievement, and School Environment, plus College Readiness for high schools. Weights vary by school level, and equity data is shown for context but not scored.

Keep reading

Explore more

Related reading

Data from NCES Common Core of Data, Arizona Dept. of Education, and U.S. Census ACS. The period is shown with each figure or in its source details.Rankings computed by MySchoolScout. See all data sources.